Jonas Bauer · 1 October 2026
Urban Beekeeping Collectives Track Local Honey Intake Against Seasonal Allergy Flare-Ups in Dense City Neighborhoods
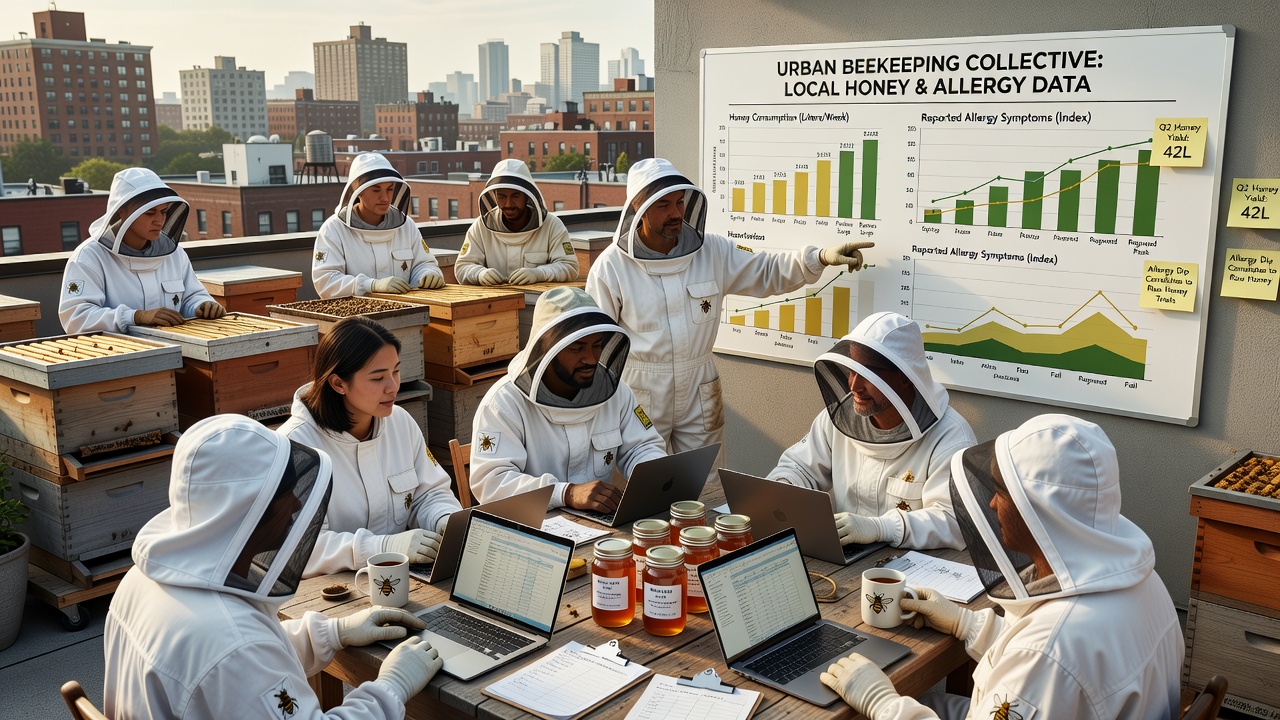
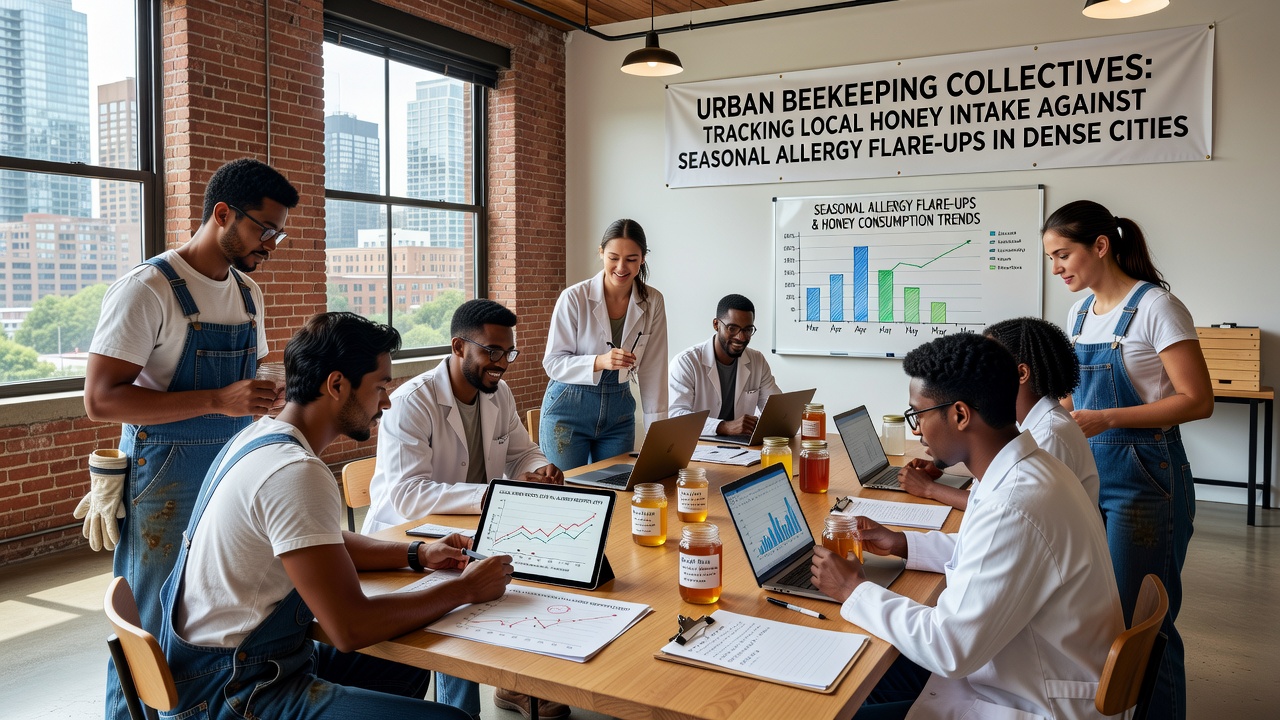
Urban beekeeping collectives across major cities have started compiling detailed records that pair local honey consumption volumes with seasonal allergy reports from residents in high-density neighborhoods, and these efforts draw on data gathered through community surveys and hive monitoring programs that operate year-round. Observers note that participants collect information on honey intake measured in weekly servings while cross-referencing it against self-reported allergy symptoms such as sneezing, itchy eyes, and nasal congestion that typically peak during pollen seasons. Researchers from multiple institutions have documented similar initiatives in places where rooftop and community garden hives supply honey to nearby households, which allows direct comparison between the geographic source of the honey and the timing of allergy complaints.
Data Collection Methods in Practice
Collectives coordinate with local residents to distribute intake logs that record daily honey use alongside environmental factors like temperature, humidity, and pollen counts obtained from municipal weather stations, and these logs feed into shared databases maintained by volunteer coordinators who verify entries through periodic follow-up calls. Studies conducted in several North American cities show that participants often maintain records for at least six consecutive months, which produces datasets large enough for statistical analysis of correlations between honey source proximity and symptom intensity. In October 2026 multiple groups released aggregated figures indicating that neighborhoods with active hive clusters reported measurable differences in allergy patterns compared with control areas lacking such programs, although the exact mechanisms remain under investigation by epidemiologists.
Geographic and Seasonal Patterns
Tracking efforts reveal that honey produced within a five-kilometer radius of participant homes tends to appear more frequently in daily routines during spring and fall months, while symptom logs indicate corresponding shifts in reported flare-up frequency that align with local flowering cycles of common urban trees and grasses. Data from these programs demonstrate that collectives in denser districts achieve higher participation rates when they host monthly workshops explaining how to record intake accurately and how to distinguish seasonal allergies from other respiratory issues. Government health agencies in Canada and Australia have begun referencing these community-generated datasets when updating regional pollen forecasts, which provides an additional layer of validation for the tracking protocols.
One collective operating in a mid-sized Midwest city integrated sensor-equipped hives that transmit real-time weight changes reflecting honey production volumes, and this technology allows coordinators to correlate production spikes with periods of increased resident honey distribution that occur just before peak allergy months. Figures released by the group indicate that residents consuming at least two tablespoons daily during high-pollen weeks logged fewer symptom days on average, yet researchers emphasize that controlled clinical trials are still needed to isolate honey effects from other variables such as medication use and lifestyle differences.
Integration with Public Health Monitoring
Public health departments in several European regions have expressed interest in incorporating collective tracking outputs into broader environmental health surveillance systems, since the localized nature of the data complements satellite-derived pollen maps and hospital admission records. According to reports from the European Centre for Disease Prevention and Control, community-sourced allergy metrics can improve the granularity of regional forecasts when combined with traditional clinical data streams. Collectives maintain strict privacy standards by anonymizing all participant information before sharing summaries with academic partners, which encourages broader involvement from residents who might otherwise hesitate to disclose health details.
Training sessions offered by the collectives cover proper hive maintenance alongside basic data entry techniques, and participants learn to identify which floral sources contribute most to honey batches harvested in specific months. This knowledge helps refine tracking accuracy because residents can note whether a particular honey variety correlates with reduced symptoms during ragweed season or tree pollen peaks. Industry organizations focused on urban agriculture have begun publishing case studies that highlight successful implementations, and these documents serve as reference materials for new groups forming in previously unmonitored neighborhoods.
Challenges in Scaling the Approach
Scaling these tracking systems across additional cities encounters obstacles related to inconsistent reporting formats and variable participation levels that fluctuate with weather conditions and community outreach capacity. Some collectives address these issues by developing standardized mobile applications that prompt daily entries and automatically pull local environmental data, which reduces manual effort and improves data completeness over time. Evidence from pilot programs suggests that neighborhoods with established beekeeping networks achieve more consistent longitudinal records than areas where hives were introduced more recently.
Future Directions for Research
Academic teams collaborating with collectives continue to explore whether microclimates created by dense urban vegetation influence both honey composition and allergy prevalence in measurable ways, and preliminary models incorporate variables such as building density, green space percentage, and traffic volume. Health Canada has supported select projects through grant mechanisms aimed at environmental health innovation, while similar funding streams in Australia support parallel efforts that compare outcomes across coastal and inland urban zones. These cross-regional comparisons help identify which factors most strongly predict successful tracking outcomes and where additional resources could strengthen data reliability.
Conclusion
Urban beekeeping collectives continue expanding their tracking programs by refining data collection tools and strengthening ties with public health entities, which produces increasingly detailed records of honey intake patterns matched against seasonal allergy reports in dense neighborhoods. The ongoing work supplies researchers with granular datasets that complement broader epidemiological studies and supports development of localized environmental health strategies. As participation grows and methodologies standardize, the resulting information offers a practical foundation for understanding connections between urban honey sources and resident allergy experiences across varied city landscapes.